
In early 2026, U.S. home sales have shown mixed performance, with overall sales continuing to lag historical averages. Existing home sales dipped sharply in January 2026 to an annual rate of ~3.91 million units — the lowest in over two years — highlighting ongoing affordability constraints and limited inventory levels nationwide.
This national context sets the stage for state-level differences, where some states outperform others in terms of sales activity and pricing dynamics.
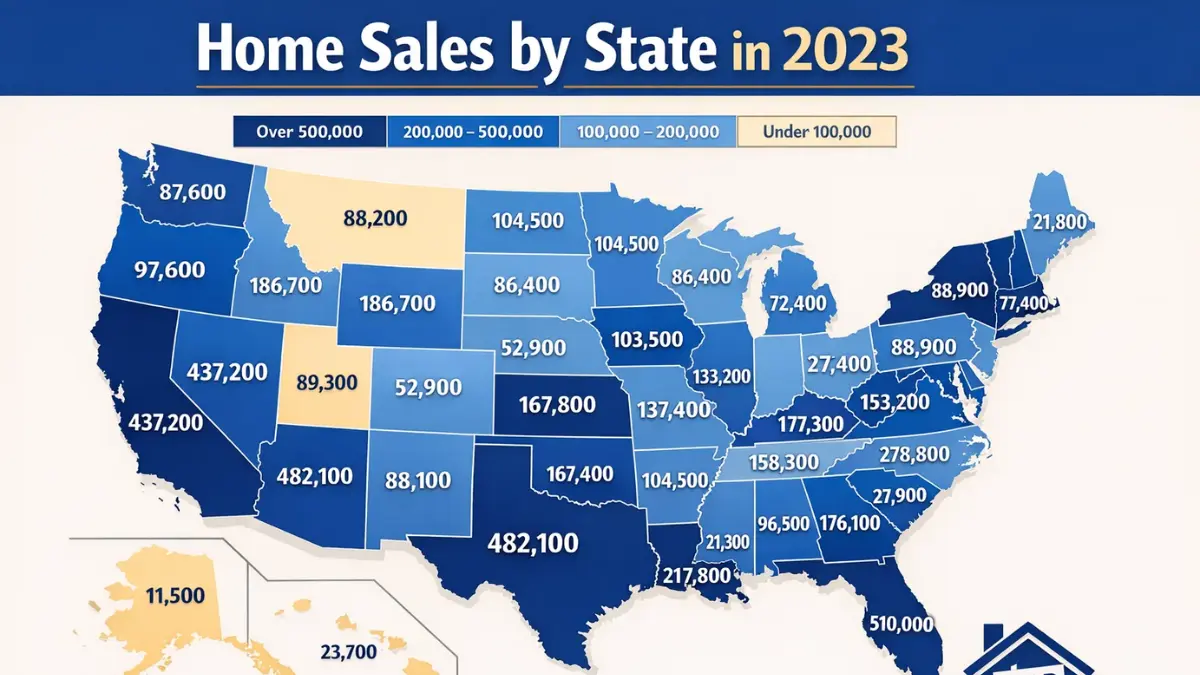
State-Level Sales Highlights
Although uniform state data for all 50 states in 2026 is not yet available, mid-2025 figures and recent patterns provide a strong indication of the leading states in home sales:
🏆 Top States by Sales Volume (Mid-2025 Proxy)
These states recorded the highest reported home sales volumes in mid-2025 — a useful indicator of sustained buyer activity:
- Florida — ~31,636 homes sold
- Texas — ~30,386 homes sold
- California — ~24,453 homes sold
- Georgia — ~12,320 homes sold
- Ohio — ~12,276 homes sold
- Pennsylvania — ~>11,850 homes sold
- New York — ~8,879 homes sold
Together, Florida, Texas, and California alone accounted for nearly 20% of nationwide existing home transactions in that sample period — reaffirming their roles as deep and active markets with large housing inventories and diverse buyer pools.
Regional Patterns in Home Sales
South
- Texas and Florida continue to dominate sales volume due to job growth, comparatively lower taxes, and strong migration into southern metros.
- The South also benefits from relatively lower home prices compared to coastal states, enabling stronger sales activity among first-time and move-up buyers.
West
- California remains a high-volume but more price-constrained market. Sales there have slowed relative to national peers, as elevated home values dampen buyer activity — even as listings persist at historically lower levels.
- Other Western states show regional variations, with some markets selling quickly despite high price points.
Midwest
- States like Ohio, Illinois, and Pennsylvania show stable sales backed by affordability and balanced inventory, appealing to local buyers and relocating households.
Northeast
- New York and Pennsylvania typically have strong sales activity despite higher costs, supported by population density and urban employment centers.
Home Price Growth Across States
Pricing dynamics often correlate with sales trends. According to the Federal Housing Finance Agency (FHFA), most states saw home price increases between late 2024 and 2025, a trend extending into 2026:
Top states with strongest annual price growth:
- Illinois — ~6.9%
- New York — ~6.8%
- North Dakota — ~6.3%
- New Jersey — ~5.9%
- Connecticut — ~5.8%
Meanwhile, a handful of states — including Florida — saw price declines year-over-year, pointing to regional differences in sales momentum and affordability pressures.
Sales Conditions & Market Factors by State
📉 Affordability & Inventory
Despite lower mortgage rates compared with earlier years, inventory remains limited — especially in high-demand states. Limited listings often drive up prices and reduce turnover, particularly in entry-level tiers.
📊 Supply & Seller Activity
In markets with higher inventory — often in the Midwest and some South regions — homes tend to stay listed longer, giving buyers more negotiation room.
📈 Migration & Demand Shifts
State migration trends influence sales volume:
- States with strong inbound migration like Texas and Florida historically see sustained demand.
- Slower inbound flows (e.g., fewer people moving to Florida in 2025 compared to earlier years) may moderate sales growth.
New Construction Sales by Region
New home sales also vary by location. For example, in 2025 the South accounted for the majority of new home transactions, while the West and Northeast showed more mixed results.
This trend highlights how builder activity and regional supply shapes overall sales volumes and options available to buyers.
Key Takeaways By State
- Florida: Historically high sales volumes, though recent migration slows may moderate activity.
- Texas: Strong demand driven by jobs, affordability, and population growth.
- California: High price levels suppress sales relative to demand potential.
- Ohio & Pennsylvania: Reliable sellers market with balanced home prices and solid turnover.
- New York & Illinois: Large markets with strong price growth but constrained inventory.
- Midwestern and Southern States: Often present better affordability for first-time buyers.
Conclusion
U.S. home sales in 2026 show a regional mosaic of trends, where state-level conditions matter more than national averages. While statewide home sales volumes are generally below long-term historical norms, states with strong economic fundamentals, population growth, and balanced affordability continue to lead the pack.
Understanding which states are outperforming — and why — gives buyers, sellers, and investors meaningful insight into where demand is most robust and where opportunities may exist in a challenging yet dynamic real estate landscape.